JerungBursa is a quantitative Bursa Malaysia stock screener and market intelligence platform designed to track institutional smart money accumulation and high-momentum IPO leaders systematically. The platform synthesizes daily price action, volume liquidity dynamics, and official Bursa Malaysia Section 138 substantial shareholder filings into algorithmic multi-factor radars โ recalculated daily post-market close at 5:00 PM MYT.
Core Analytics Radars:
Every strategy is benchmarked with transparent backtest metrics (win rate, average gain, maximum drawdown/worst loss, and profit factor) verified continuously. All performance figures displayed are SIMULATED BACKTEST RESULTS derived from historical price action โ not actual executed trades or guarantees of future returns.
โ ๏ธ Risk Disclosure: JerungBursa is an independent financial research and educational tool, not a licensed financial advisory service. Equity investing and trading โ particularly in fresh IPOs and growth stocks โ carries inherent capital risk. Please review our full Terms & Disclaimer prior to making investment decisions.
Formula Minervini + Mamat: Contraction C1 โ C2 โ C3 + MA50 > MA200 & Pullback EMA25. Ultra-tight SL risk (โค3%-5%), Maximum Breakout Potential!
| No | Kaunter | Kategori Setup | Current Price | Change % | Support Floor Price | Floor Distance | Volatiliti | Stop Loss (SL) | Turnover | History |
|---|---|---|---|---|---|---|---|---|---|---|
| โณ Loading VCP Staircase stocks... | ||||||||||
Track accumulated net buying by major institutional whales: EPF/KWSP, PNB, KWAP, Khazanah & Top Fund Managers based on official Section 138 Substantial Shareholder filings.
| Filing Date | Company & Code | Institution (Whale) | Action | Units Changed | Current Holding (%) | Radar Signal | Dokumen Bursa |
|---|
Smart money quiet accumulation setup before breakout: Quiet Volume + progressive floor touches + tightening closes. Includes ๐๏ธ Secondary Base โ stocks with deep pullbacks building tight new bases (e.g. SKYCHIP).
| No | Counter | Tier | Setup Category | Current Price | ATH Pullback | Support Floor @ Price | Close Tightness | Turnover | Volume Status | Change % | History | Score |
|---|---|---|---|---|---|---|---|---|---|---|---|---|
| โณ Loading whale radar... | ||||||||||||
๐ Tier 1 QUIET ACCUM: Quiet Volume + isConsolidation + close tightness โค5% + pullback โค15%. Earliest phase before public visibility.
๐ฆ Tier 2 WHALE ENTRY: Early volume spike (<3x) BUT pre-breakout + close tightness โค10% + pullback โค15%. Institutional accumulation phase.
๐๏ธ Tier 3 SECOND BASE: Deep pullback (15-30%) from ATH BUT building a tight new base โ close tightness โค5%, floor touches โฅ5x, holding above SMA50. Smart money accumulating quietly (e.g. SKYCHIP).
Note: Always enforce Stop Loss regardless of setup pattern.
Fresh Rider Core Filters: ๐ Fresh IPO (2025+) โข ๐ VVIP Accumulation (Turnover โฅ RM 2.0M) โข ๐ก๏ธ Anti-Debut Dump (Age > 15 days OR โฅ 3 floor touches) โข ๐ฆข Black Swan Shield (Free from QR & Ex-Div Traps) โข ๐ฏ Ultra-Tight Base (Risk โค 10%, Tightness โค 5%). Scanned continuously.
| No | Stock & Category โ | Trend Status | Tightness % โ | Support Floor (Risk %) โ | Trigger & Dist % โ | Pullback % โ | Price & Change % โ | Turnover โ | Confluence โ | Score & History โ |
|---|---|---|---|---|---|---|---|---|---|---|
| โณ Loading Fresh VVIP Rider... | ||||||||||
* SIMULATION โ assumes each trade is closed after 20 days (regardless of win/loss), to verify profitability of entry rules. Each counter is counted once (first qualifying day). Recalculated automatically daily.
Totals sum individual trade returns in percentage points (pp), before fees and slippage. RM figures assume RM2,000 per trade; these are not portfolio ROI. This Live Tracker shows the latest positions, including when the scanner above displays an archive.
| # | Counter | Status | Trend Status | Entry Date | Entry Price | Current / Exit Price | Pulangan Hold (PnL / RM 2k) | Max Gain | Days Held | Radar Status | ๐ฆข Risk Check | Trailing SL (Hybrid 20โ10%) |
|---|---|---|---|---|---|---|---|---|---|---|---|---|
| โณ Loading Fresh Rider tracker... | ||||||||||||
* ACTUAL POSITIONS โ hold every counter from qualification day until triggering the hybrid trailing stop (SL = high ร 0.80 before profit lock, tightens to high ร 0.90 after +20% locked). CLOSED_SL = locked profit/loss. This is an actual holding record, NOT a simulation โ e.g. backtest closed KEEMING early at +65%, while tracker held up to +117%. Auto-updated on every data refresh.
Complete institutional market scanner listing all tracked equities with Fresh Rider metric columns: Squeeze Tightness %, Support Floors, Initial Trigger Base, Pullback from ATH, Smart Money Turnover, Corporate News & Ex-Dividend Risk Badges, and AI Trading Plan generator.
| No | Stock & Category โ | Trend Status | Tightness % โ | Support Floor (Risk %) โ | Trigger & Dist % โ | Pullback % โ | Price & Change % โ | Turnover โ | Confluence โ | Score & History โ |
|---|---|---|---|---|---|---|---|---|---|---|
| โณ Loading All Market Universe data... | ||||||||||
Counters overlapping in 2+ strategies simultaneously (Jerung Radar + VCP + Trend Rider + Early Spring + Bottom Fishing). Combined 2+ backtest = 104 unique counters, WR 60%, avg +5.6%/trade, total +584.5% (63 trading days / ~90 calendar days: May 25 โ Aug 20, 2026). TRIPLE (3+) 89 signals (WR 61%, +5.1%) โ DOUBLE (exact 2) 92 signals (WR 60%, +5.3%) โ both comparable, Double slightly higher avg gain. Compare ๐ฅ Fresh Rider (โ signals): WR โ, avg โ/trade, total โ โ higher win rate per trade with fewer total signals.
| No | Stock | Confluence Level | Fresh Rider? | Current Price | Support Floor Price | Turnover | Change % | History | Score |
|---|---|---|---|---|---|---|---|---|---|
| โณ Loading Confluence Radar... | |||||||||
| Confluence Setup | Signals | Win Rate | Avg/Trade | Total PnL | Worst Loss |
|---|---|---|---|---|---|
| ๐ฅ TRIPLE (3+ strategies) | 89 | 61% | +5.09% | +453.4% | โ11.1% |
| โก DOUBLE (exact 2 strategies) | 92 | 60% | +5.31% | +488.5% | โ13.8% |
| ๐ All 2+ Combined (All Equities) | 104 | 60% | +5.62% | +584.5% | โ13.8% |
| ๐ 2+ Fresh IPO Only | 43 | 65% | +7.84% | +336.9% | โ11.3% |
| ๐ TRIPLE + Fresh IPO (Top Performer) | 36 | 72% | +8.51% | +306.2% | โ9.9% |
* Each counter counted once (first qualification date). Total PnL = cumulative return (non-compounded). Triple = highest PnL per trade; Double = increases signal frequency & overall cumulative PnL.
Hot Theme Core Filters: ๐ญ Active Thematic (Semicon/Solar) โข โก Confluence Signal (Turnover โฅ RM 2.0M) โข ๐ก๏ธ Anti-Debut Dump (Age > 15 days OR โฅ 2 floor touches) โข ๐ฆข Black Swan Shield (Free from QR & Ex-Div Traps) โข ๐ฏ Ultra-Tight Base (Risk โค 10%, Tightness โค 5%). Scanned continuously.
| No | Stock & Theme โ | Trend Status | Tightness % โ | Support Floor (Risk %) โ | Trigger & Dist % โ | Pullback % โ | Price & Change % โ | Turnover โ | Confluence โ | Score & History โ |
|---|---|---|---|---|---|---|---|---|---|---|
| โก Loading Hot Theme Rider... | ||||||||||
* SIMULATION โ assumes every trade is closed after 20 holding days (regardless of PnL) to prove baseline entry edge. Each counter counted once on first qualification date. Automatically recalculated daily.
Totals sum individual trade returns in percentage points (pp), before fees and slippage. RM figures assume RM2,000 per trade; these are not portfolio ROI. This Live Tracker shows the latest positions, including when the scanner above displays an archive.
| # | Counter | Status | Trend Status | Entry Date | Entry Price | Current / Exit Price | Pulangan Hold (PnL / RM 2k) | Max Gain | Days Held | Radar Status | ๐ฆข Risk Check | Trailing SL |
|---|---|---|---|---|---|---|---|---|---|---|---|---|
| โณ Loading live tracker... | ||||||||||||
๐ก Usage Guide: Theme Strength = % top volume turnover flowing into Semicon+Solar equities. Empirical study: signals entered during RISING strength averaged +10.7% vs FALLING strength +12.5% โ major winners (KEEMING +70%, DNEX +38%, VITROX +36%) entered during falling strength, so falling strength is NOT a disqualifier. Use strength to adjust position sizing: strength > 20% = hot theme, standard position size; 10โ20% = moderate, reduce size; < 10% = cool, halve position size (or restrict to ๐ฅ TRIPLE signals).
Stocks simultaneously qualifying for Fresh Rider (IPO / Base Breakout & Low Float Squeeze) AND Hot Theme Leaders (Semiconductors, Solar, AI Infrastructure). Dual institutional tailwinds produce the highest historical win rate on Bursa Malaysia.
| No | Stock & Sector Theme | Signal Status | Tier Quality | Tightness % | Support Floor | Current Price | Turnover (RM) | Confluence | Trade Plan (SL / TP) | Chart |
|---|
Pantau prestasi setiap signal mengikut tarikh kemasukan (Daily Cohorts). Gabungan strategi ๐ฅ Fresh Rider & โก Hot Theme yang di-hold menggunakan Hybrid Trailing Stop sehingga profit lock / exit.
| # | Kaunter | Strategi | Pergerakan Hari Ini | Sumbangan PnL Hari Ini | Harga Semasa | Entry Price | Tarikh Entry | Pulangan Hold (PnL / RM 2k) | Peak Max Gain | Trailing SL | Radar Action | Chart |
|---|---|---|---|---|---|---|---|---|---|---|---|---|
| โณ Memuatkan pergerakan saham hari ini... | ||||||||||||
| # | Tarikh Entry | Jumlah Signal | Pecahan Strategi | Senarai Kaunter | Status (OPEN / CLOSED) | Day 1 PnL | Pulangan Hold (PnL / RM 2k) | Avg Gain / Trade | Win Rate % | Top Performer | Tindakan |
|---|---|---|---|---|---|---|---|---|---|---|---|
| โณ Memuatkan ringkasan tarikh... | |||||||||||
Senarai kedudukan kaunter dengan kenaikan peratusan tertinggi (% Gain) selepas pasaran tutup. Disediakan paparan Top 30, Top 50, dan tapisan saham bawah RM1.00.
| Kedudukan | Kaunter (TradingView) & Status | Current Price | Change (RM) | % Gain | Volume / Turnover | Trend Alignment |
|---|---|---|---|---|---|---|
| Memuatkan data Top Gainers... | ||||||
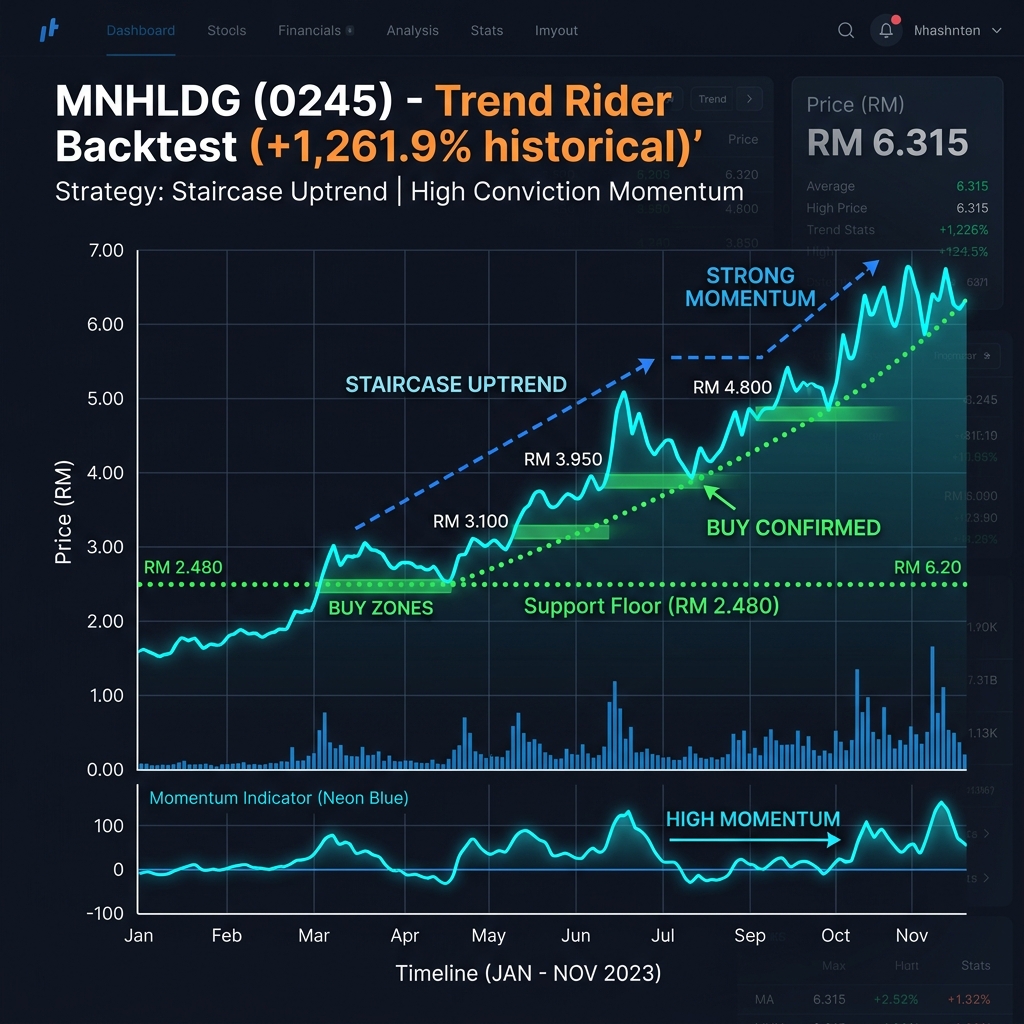
Core SOP (Optimized): VVIP Trend Rider (5-Slot Beli & Peram). Peram selagi di atas Support Floor (SL -3%). Style: RIDE THE TREND (No Rigid TP)!
| No | Kaunter | Kategori Setup | Current Price | Change % | Support Floor Price | Floor Distance | Volatiliti | Stop Loss (SL) | Turnover | History |
|---|
Buy high-quality stocks (Grade A/B) with strong upward momentum. Enter at safe zones (near Support Floor) and hold as long as price stays above this line to maximize gains without rigid TP targets.
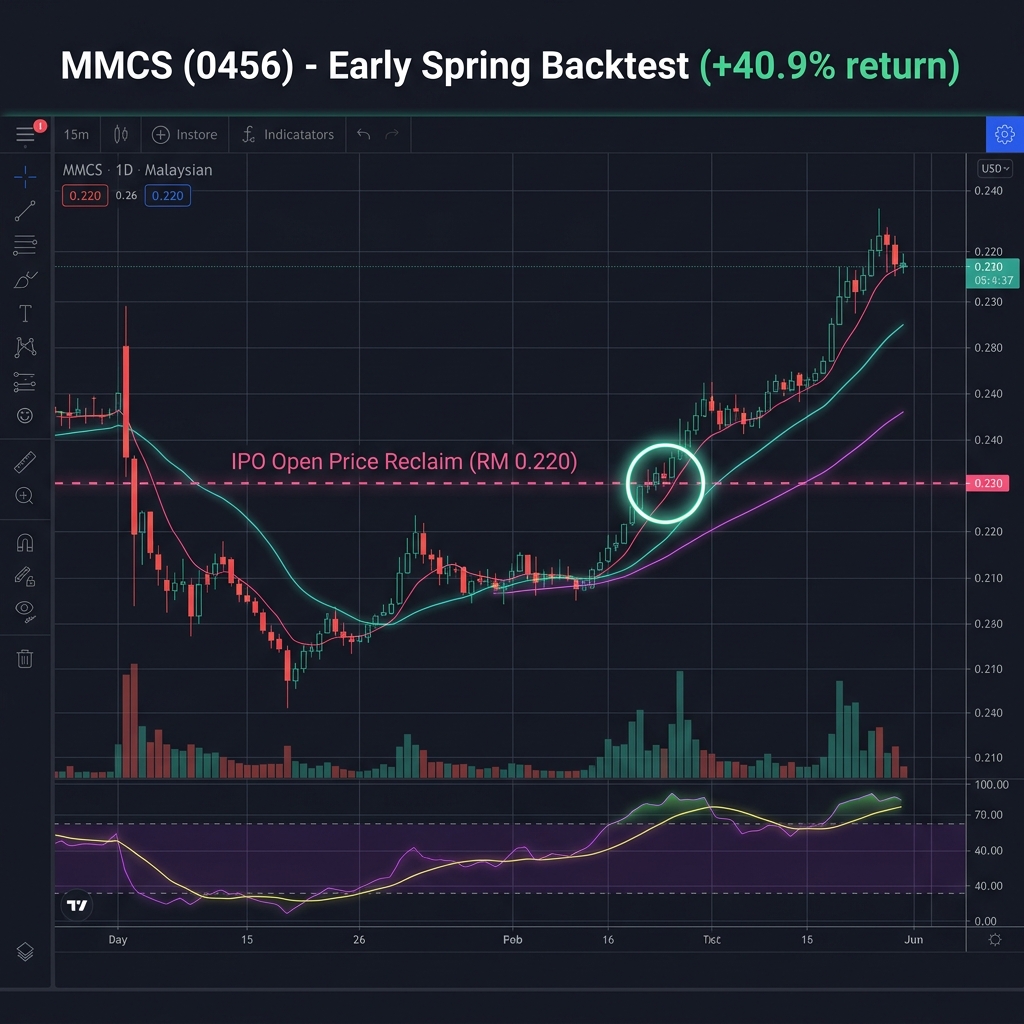
SOP Reclaim: Fresh IPO (2025 - 2026) trading underwater (below day-1 Open Price). Buy Trigger: When price reclaims above the Open Price line (TRIGGER)!
| No | Kaunter | Kategori Setup | Current Price | Change % | Open Price (Trigger) | Trigger Distance | Volatiliti | Support Floor Price | Turnover | History |
|---|
The Early Spring technique is a momentum breakout strategy. Stocks breaking above the Open Price have potential to run high, but are exposed to False Breakout risks.
Strict SOP: If the price falls back below the Open Price (Trigger), you must CUT LOSS immediately. This discipline limits losses to -2% to -3% only instead of letting the stock plunge like SRKK.
Detects fresh IPO stocks trading below their first-day opening price (underwater). A buy signal is triggered when the current price reclaims and crosses above the Open Price.
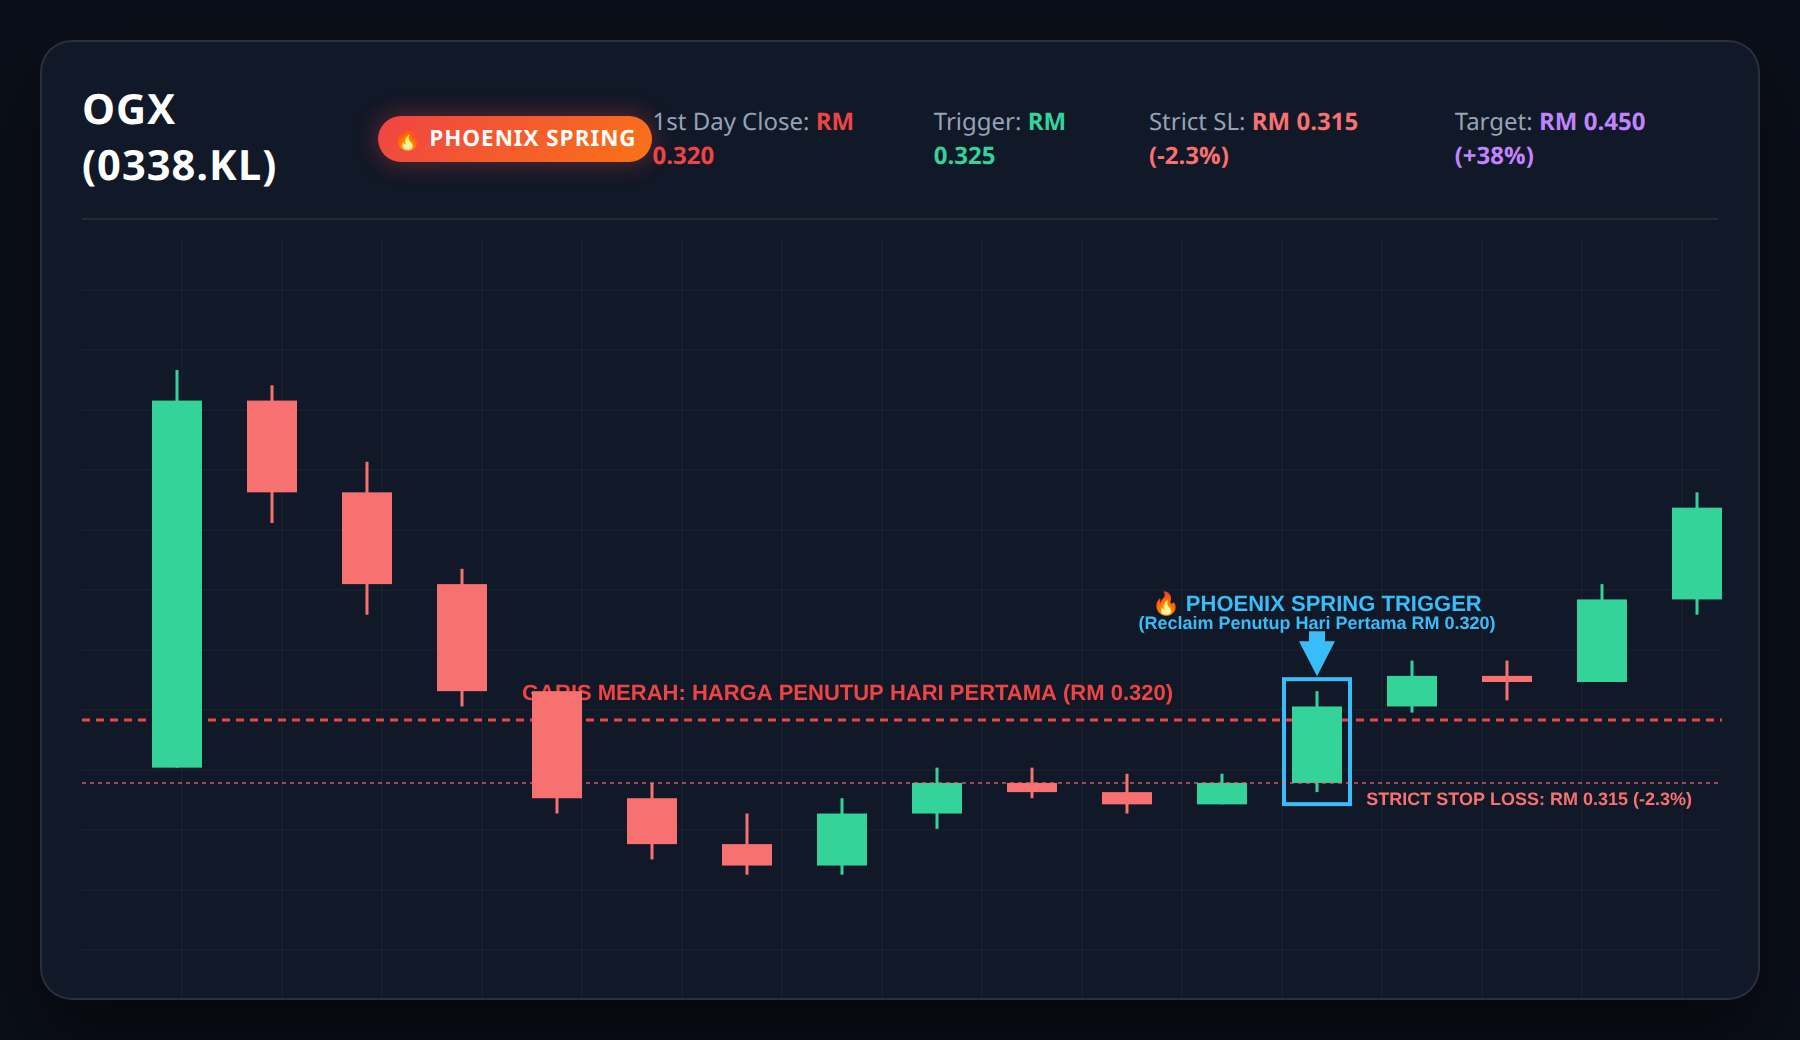
SOP Phoenix Spring: Fresh IPO trading underwater (below first-day close price). Buy Trigger: When price reclaims above the First-Day Close Red Line (TRIGGER)!
| No | Kaunter | Kategori Setup | Current Price | Change % | 1st Day Close (๐ด Red Line) | Red Line Distance | Support Floor Price | Turnover | Setup Status | History |
|---|
The Phoenix Spring technique is a momentum reclaim breakout strategy. Stocks crossing back above the First-Day Close Red Line have potential to rally high towards wave-2 ATH peaks.
Strict SOP: If the price falls back below the First-Day Close Red Line, you must CUT LOSS immediately. This discipline limits losses to -2% to -3% only.
Detects fresh IPO stocks trading below First-Day Close Price (Red Line). A buy signal is triggered when a green candle crosses above the close price (Reclaim) or rebounds off the Red Line support floor with ultra-tight risk (SL ≤ 3%).
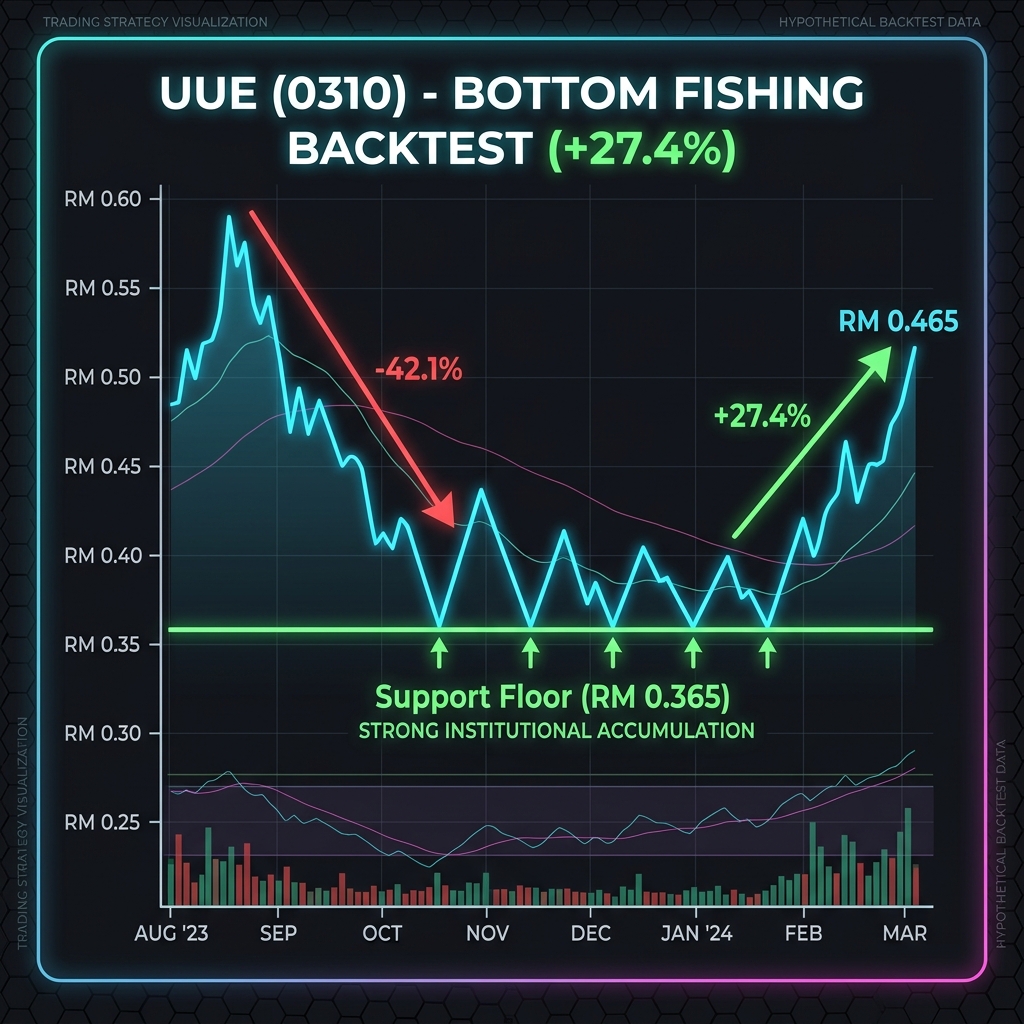
Bottom Fishing SOP: Detects quality stocks with severe pullbacks from peak (Pullback โฅ 35%) building a strong accumulation floor (Floor Distance โค 5.0%, Touches โฅ 3x).
| No | Kaunter | Kategori Setup | Current Price | Change % | Support Floor Price | Floor Distance | Volatiliti | Pullback % | Turnover | History |
|---|
Detects quality stocks that have pulled back severely from peak (Pullback โฅ 35%) and are building a strong accumulation floor (Floor Distance โค 5.0%, Touches โฅ 3x).
Berbeza dengan scanner breakout biasa yang menunggu lilin hijau, enjin ini melaksanakan rahsia sebenar AE, Takashi Kotegawa (BNF) & Shigeru Fujimoto: Masuk ketika kaunter sedang JATUH MERAH (Change ≤ 0%) pada harga diskaun (Pullback ≥ 10% atau Bawah MA25) betul-betul di atas Lantai Sokongan Jerung (Floor ≤ 3.5%, Touches ≥ 3x). Kos tapak yang sangat rendah membolehkan pegangan gelombang besar memberikan pulangan puluh, ratus & ribu peratus.
RM1.760 & RANHILL Tapak 1 RM2.360) membina Lantai Sokongan Baharu yang lebih tinggi dan keluar semula di Scanner pada hari merah, ia adalah โ
Tiket Re-Entry (Wave Ke-2) atau โ Tiket Add-On Lantai Baharu dan direkodkan sebagai baris baharu dalam Live Tracker! Baca Kajian & SOP Lengkap di Articles & Strategy โ
| No | Kaunter & Kategori | Signal Entry BNF | Harga & Red Dip % | Zon Lantai Sokongan | Pelan SL & Target TP | Turnover Jerung | Tindakan |
|---|---|---|---|---|---|---|---|
| ๐ Mengimbas kaunter BNF & Fujimoto (Masuk Time Jatuh)... | |||||||
Live Tracker ini hanya merekodkan kemasukan Formula #1 (๐ Gred A+ Leader Dip) dan menolak kaunter umum Gred B secara automatik. Setiap dagangan dilabelkan mengikut 3 Signal Utama: โก BNF PANIC (Bawah MA25), ๐ก๏ธ LANTAI KEBAL (Floor ≤ 1.5%), dan ๐ FUJIMOTO DIP (Pullback ≥ 10%).
| # | Kaunter & Label Entry | Signal Entry BNF | Status | Tarikh Masuk (Waktu Jatuh) | Harga Masuk & Red Dip % | Diskaun Pullback & Lantai | Harga Exit / Semasa | Pulangan Sistem (PnL / RM2k) | Pulangan Pure Hold | Max Gain (Puncak) | History |
|---|
Jerung Discipline Rule: Divide total trading capital into max 3 active slots to eliminate overtrading, calculate exact unit lot capacity, and limit portfolio risk ≤ 5%.
Select an individual stock to inspect exact unit math, support floor margin, and profit milestones.
Checking available data.
Comprehensive guide to understanding terms, badges, data columns, and filter functions.
When viewing the "Counter" column in table rows (e.g. ECA), the metadata components are structured as follows:
These badges appear automatically when live market parameters match the technical DNA of top 3 historical backtest winners.